
Culture
![]() 14 min read
14 min read
SPACE: An Engineering Productivity Framework Focused on the Human Elements

Engineering organizations often look for ways to measure productivity and velocity, but it isn’t always easy to find the right framework that can be adopted with success or even embraced by the engineering teams. In this blog, we will share how we landed on the SPACE framework, our plans to implement, and how we rolled out this vision to the engineering organization.
Motivation for having an engineering productivity framework focused on the human elements
If you have been following our Artera journey since the beginning of the blog, you may have learned that we went through Tuckman’s Stages of Group Development (or you may know it as forming, storming, norming, and performing). In 2022, we focused on the forming and storming stages when we restructured the organization into triad models and built new organizational processes to help us scale. In 2023, we rallied around the norming stage when we defined more concrete team processes and evolved many of our existing processes to enhance our overall harmony. In 2024, we really want to focus on the performing stage which centers around progressing towards our goals and how we measure towards these goals. One of the initiatives that will help us measure how we are performing is to introduce a productivity framework to the engineering organization.
Often times, when metrics are introduced, it can be met with hesitancy or even resistance by some individuals. Later in the blog, we will talk about why that is not the case at Artera and how metrics can be used in a more positive way and not as a tool for micromanagement. It is also important to note that we are choosing a framework that is more than just about productivity, but also the human elements like engineers’ satisfaction and well-being.
How do we ensure the teams ultimately reap the benefits of an engineering productivity framework?
To help level set that the new framework benefits everyone, we thought best to bust 5 myths around productivity metrics with our engineering organization (which we referenced from the whitepaper ‘The SPACE of Developer Productivity’).
- Productivity is all about developer activities. Well. It is not. Too many meetings and crazy hours create more activity but that doesn’t mean productivity. Even straightforward metrics such as number of pull requests, commits, or code reviews are prone to errors. We won’t purely focus on activity as an organization.
- Productivity is only about individual performance. At Artera, we believe software development is a team sport. A developer who optimizes only for their own personal productivity may hurt the productivity of the team. More team-focused activities such as code reviews, on-call rotations, and developing and managing engineering systems help maintain the quality of the code base and the product/service. We will not focus on individual performance.
- One productivity metric can tell us everything. This is just not true. It is impossible to get a full picture of how we are doing through one single metric. We don’t have one nor will we ever have one metric that can tell us everything.
- Productivity measures are useful only for managers. It is unfortunate and disappointing that productivity is often perceived as a tool for just managers. Research has shown that high productivity is highly correlated with feeling satisfied and happy with work, so it is important that everyone uses productivity measures to find optimization. Productivity measures are actually more useful for non-managers.
- Productivity is only about engineering systems and developer tools. There is a famous saying “culture eats strategy for breakfast.” There are tons of events and activities that have a culture element and are like invisible glue holding things together. This includes something as small as a meme in a Slack channel to people elegantly taking care of sev 1 issue. That glue is what will unite us and it is important to keep an eye on making sure that our culture can never become toxic. So there are cultural elements that make us more productive too, not just systems and tools.
With these myths busted, our intention is that teams do not feel the need to game the system. The ultimate reward of leveraging a productivity framework is for all the teams to get better and yield more satisfaction, joy, and happiness in their day to day.
Why did we choose SPACE as the right engineering productivity framework… and what is it?
In 2023, we brought in a third-party tool to help us measure and track DORA metrics — deployment frequency, lead time for changes, change failure rate, and time to restore services. While these are really important key metrics to indicate performance of a software development team, we did not think it was comprehensive enough to indicate other important factors of a team, such as their overall health and happiness in the workplace and how qividuals, teams and organization!
SPACE is an acronym that represents 5 dimensions of engineering productivity. Here, we list out the 5 dimensions and included the definitions as provided in the whitepaper ‘The SPACE of Developer Productivity’.
- Satisfaction and well-being. Satisfaction is defined as how fulfilled developers feel with their work, team, tools, or culture; well-being is how healthy and happy they are, and how their work impacts it.
- Performance is defined as the outcome of a system or process.
- Activity is a count of actions or outputs completed in the course of performing work.
- Collaboration & communication is how people and teams communicate and work together.
- Efficiency and flow is the ability to complete work or make progress on it with minimal interruptions or delays, whether individually or through a system.
In the following sections, we will walk through specific metrics and events we have in place that represent all the dimensions of SPACE.
Our First Iteration of SPACE
What we selected and why
We went through a very thoughtful and deliberate process to choose our metrics. We knew that we didn’t want to add a lot of new metrics, as that would add a lot of unnecessary change. We wanted to make sure that we had the org’s engagement from the beginning so we wanted it to be a smooth process. We were already doing many things and tracking metrics, but we really needed a framework to bring it all together.
To start the process, the engineering leadership team along with engineering managers listed all of the metrics we were currently tracking in each of the categories along with new metrics that we thought would be useful. We made a conscious decision to only include metrics at the team and org level. We chose to exclude “individual” metrics because in our minds, software engineering is a team sport and we wanted to focus our efforts on how we can improve collectively.
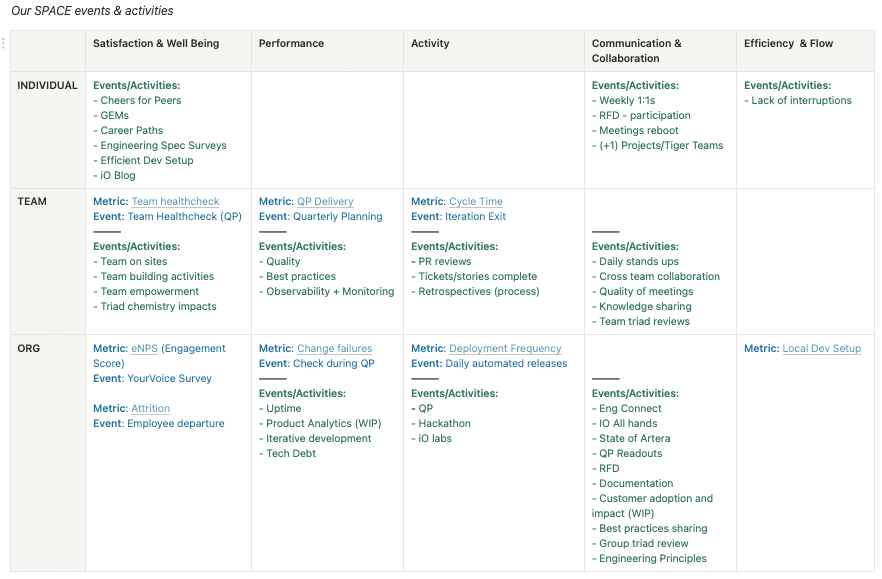
The following metrics are what we chose for the first iteration:
Satisfaction & Well Being
At the team level, we are focusing on our team health check process. For the last couple of years, we’ve had each team spend time every quarter doing a health check, which answers 14 questions like are team members learning new things, are they having fun, how is our code base quality, and do they feel we are delivering value. The team health check enables teams to understand their strengths, identify areas of improvement, and hold themselves accountable to making these improvements. At our scale, software development is a team sport and in order to win at team sports, healthy teams are critical.
To be able to put a metric on the team health check process, we asked each team to track 3 action items. Our main goal is to ensure that each team is working to continuously improve the health of their team.
At the organization level, we are tracking our engagement through the eNPS. This helps us to identify initiatives that will improve our overall employee engagement and satisfaction. Engaged employees are happy employees! We are able to track this through a company-wide survey called the YourVoice survey.
We are also tracking attrition and aim to be under 10% attrition. This gives us insight into how our employees experience the workplace. We want everyone in the engineering organization to find a purpose, growth, and opportunity here at Artera.
Performance
Each quarter, we go through a quarterly planning process so each team can plan their roadmap for the quarter. Because planning is so important to make sure everyone is aligned and the proper communication happens prior to a new feature release, we want teams to be delivering at least 80% of what they commit to for the quarter. This helps us to plan more effectively over time by identifying the right number of priorities each quarter. It also makes customers happy with new features being delivered consistently!
At the organization level, we are tracking change failures. Our goal is to have 0 Sev-1s. This metric is very important, as it helps us to gain valuable insights into the stability of our systems, processes, and technologies. Stable software makes customers (and engineers) happy!
Activity
At the team level, we are tracking Cycle Time. Our goal here is to help teams identify bottlenecks, optimize processes, limit the blast radius, and improve overall efficiency when delivering projects. To have the most impact, we asked each team to choose their own cycle time that would be helpful for their individual needs. They were able to choose from coding time, pickup time, review time, or deploy time.
At the organization level, we are tracking Deployment Frequency. This helps teams to ensure we are deploying consistently and keeping the coding bar high to have high efficiency in our deployment pipeline. We are aiming to have less than 10 release failures a month. We’re currently at 19 so this will be a stretch, but we’re excited to push ourselves in this area! We are also aiming to have more than 85% of our releases have code changes so that we have minimal automated releases that go out with 0 code changes. We are currently at 72% and feel this number is attainable.
Communication & Collaboration
For this category, we are not setting any specific metrics. It would be very challenging to measure communication and collaboration quantitatively. However, there are several events and activities that we do regularly that help ensure we are communicating and collaborating effectively, such as daily stand ups, knowledge sharing sessions, and regular team triad reviews to ensure teams are on the right track and getting the support and feedback they need to be successful.
At the organization level, we have our engineering wide all hands meeting called “Engineering Connect”, our IO All Hands, company All Hands meeting, Quarterly Planning readouts, and other forms of communication and documentation that help us to stay aligned.
Efficiency and Flow
Our local development environment is not in the most optimal state and there are many improvements that can be made to increase efficiency and flow for our engineers. We are working towards making those improvements and tracking that work as part of this category at both the team and org level. This will help our engineers to be more productive and efficient with their dev setup.
Our plan on how we track it
What’s great about the SPACE framework is that it helps us to put everything into one location. We’ve created a repository to share the SPACE metric information with all of our teams and we’ve asked each team to create their own page to track their own metrics. The information is easily accessible and helps us to all hold each other accountable. We’ll also be sharing these metrics in our Engineering Connect quarterly.
What is most important for the team metrics is that individual teams are using their own metrics to consistently improve and move into the “performing” stage. For the org-wide metrics, we are able to share where we’re at so that everyone is aligned. Once we have our first set of metrics, everyone will be able to see how we did. Then we’ll be able to hold a retrospective style meeting to see how we can improve as an organization.
As part of our org-wide continuous improvement efforts, we plan to analyze our metrics each quarter to see if updates need to be made. While we want to aim for consistent metrics quarter over quarter, there may be times when an effort has become de-prioritized and we will remove that metric. Or if we hit our goal several quarters in a row (yay!), it will be time to update that metric’s goal or change it altogether.
What is next?
Our mission is to ensure that at a team and organizational level, we are working towards a performing state and SPACE will is an important framework that will help us get there. As we iterate each quarter to see what new metrics should be added or dropped so we are always staying focused on what is most valuable. Stay tuned for a future blog that will cover an update on how we evolve SPACE for Artera quarter over quarter.
About Artera:
*Artera is a SaaS digital health leader redefining patient communications. Artera is trusted by 800+ healthcare systems and federal agencies to facilitate approximately 2.2 billion messages annually, reaching 100+ million patients. The Artera platform integrates across a healthcare organization’s tech stack, EHRs and third-party vendors to unify, simplify and orchestrate digital communications into the patient’s preferred channel (texting, email, IVR, and webchat), in 109+ languages. The Artera impact: more efficient staff, more profitable organizations and a more harmonious patient experience.*
Founded in 2015, Artera is based in Santa Barbara, California and has been named a Deloitte Technology Fast 500 company (2021, 2022, 2023), and ranked on the Inc. 5000 list of fastest-growing private companies for four consecutive years. Artera is a two-time Best in KLAS winner in Patient Outreach.
For more information, visit www.artera.io.
Artera’s blog posts and press releases are for informational purposes only and are not legal advice. Artera assumes no responsibility for the accuracy, completeness, or timeliness of blogs and non-legally required press releases. Claims for damages arising from decisions based on this release are expressly disclaimed, to the extent permitted by law.


Hack and Tell: My Experience with Artera’s Annual Hackathon
Giddy Up! Yee-Hackathon 2025 Howdy, ya’ll! I’m Eric, a senior software engineer at Artera, writing hot on the heels of…
Artera’s Guide for Running Effective Team Health Checks
Team health checks are an excellent way to get a pulse of how the team is doing; it’s a good…

Achieve Work-Life Balance: A Guide to Better On-Call Rotations
Ever wonder what happens when your favorite app or website glitches or isn’t working as expected? Behind the scenes, there…